SummerHaven Dynamic Agriculture Indexsm (“SDAI”)
SDAI INDEX METHODOLOGY
SDAI – INDEX PHILOSOPHY
The SummerHaven Dynamic Agriculture Index (“SDAI”) was developed by SummerHaven Index Management to provide an active agriculture index benchmark for commodity investors. The SDAI is based on the notion that commodities with low inventories will tend to outperform commodities with high inventories, and that priced-based measures, such as futures basis and price momentum, can be used to help assess the current state of commodity inventories1.
SDAI – INDEX CONSTRUCTION
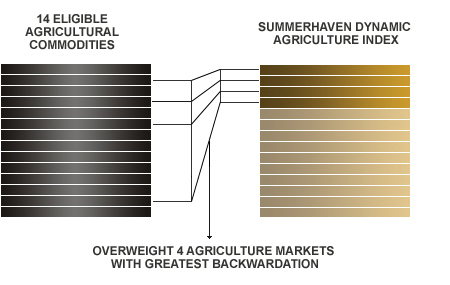
The SDAI consists of 14 agricultural markets that are included in the index each month. Seven agricultural markets are selected each month through the steps outlined below, which are designed to identify agricultural markets in a low inventory state. The agricultural markets selected will be weighted more heavily than their respective base weights, and the remaining seven agricultural markets not selected will be weighted less heavily than their respective base weights during any given month:
STEP 1: Commodity Selection – Backwardation
Choose 4 agricultural markets with the greatest backwardation (or least contango). Backwardation is measured as the annualized % price difference between the futures price for the closest-to-expiration contract and the next closest-to-expiration contract for each commodity.
STEP 2: Commodity Selection – Momentum
From the remaining 10 agricultural markets, choose 3 commodities with greatest 12-month price momentum. Momentum is measured as the % price difference between the futures price for the closest-to-expiration contract and the price of the closest-to-expiration contract 12-months ago for each commodity.
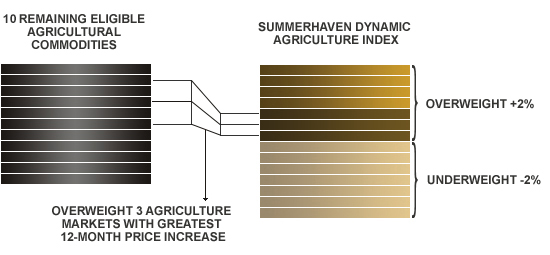
The 7 agricultural markets selected will have their weighting for the following month increased by 2%. The 7 agricultural markets not selected will have their weighting for the following month decreased by 2%. Base weights for each of the 14 eligible agricultural markets is detailed in the table below:
| ELIGIBLE AGRICULTURAL MARKETS | BASE WEIGHTING |
|---|---|
| Soybeans | 12.50% |
| Corn | 12.50% |
| Soft Red Winter Wheat | 8.00% |
| Hard Red Winter Wheat | 4.00% |
| Bean Oil | 3.00% |
| Soybean Meal | 6.00% |
| Canola | 3.00% |
| Coffee | 10.00% |
| Cocoa | 6.00% |
| Sugar | 10.00% |
| Cotton | 6.00% |
| Feeder Cattle | 3.00% |
| Live Cattle | 10.00% |
| Lean Hogs | 6.00% |
STEP 3: Contract Month Selection
For each of the 14 index commodities, SDAI selects the contract month with the greatest backwardation (or least contango), taking into account the allowed contracts and maximum tenor for each commodity market.
The maximum eligible tenor is measured as the number of months starting from the maturity of the closest-to-expiration contract. The previous not withstanding, the contract expiration is not changed for that month if a commodity remains in the index, as long as the contract does not enter expiry or enter its notice period in the subsequent month.
| COMMODITY SYMBOL | COMMODITY NAME | ALLOWED CONTRACTS | MAX. TENOR |
|---|---|---|---|
| S | Soybeans | Jan, Mar, May, Jul, Aug, Sep, Nov | 12 |
| C | Corn | Mar, May, Jul, Sep, Dec | 12 |
| W | Soft Red Winter Wheat | Mar, May, Jul, Sep, Dec | 7 |
| KW | Hard Red Winter Wheat | Mar, May, Jul, Sep, Dec | 5 |
| BO | Bean Oil | Jan, Mar, May, Jul, Aug, Sep, Oct, Dec | 7 |
| SM | Soybean Meal | Jan, Mar, May, Jul, Aug, Sep, Oct, Dec | 7 |
| RS | Canola | Jan, Mar, May, July, Nov | 5 |
| KC | Coffee | Mar, May, Jul, Sep, Dec | 7 |
| CC | Cocoa | Mar, May, Jul, Sep, Dec | 7 |
| SB | Sugar | Mar, May, Jul, Oct | 7 |
| CT | Cotton | Mar, May, Jul, Dec | 7 |
| FC | Feeder Cattle | Jan, Mar, Apr, May, Aug, Sep, Oct, Nov | 5 |
| LC | Live Cattle | Feb, Apr, Jun, Aug, Oct, Dec | 5 |
| LH | Lean Hogs | Feb, Apr, Jun, Jul, Aug, Oct, Dec | 5 |
SDAI Rebalancing:
Price observations for the steps described above are taken on the fifth-to-last business day of each month. SDAI rebalancing takes place during the last four business days of the month (the “Selection Date”). At the end of each of these days, one fourth of the prior month portfolio positions are replaced by the new over-weighted or under-weighted position in the commodity contracts determined on the Selection Date.
« Back
1 Geert Rouwenhorst, SummerHaven partner and Yale professor, is a recognized leader for his academic research linking commodity futures returns to inventories:
See “The Fundamentals of Commodity Futures Returns” under Reference Materials.